ITRF2000
Description
The ITRF2000 is divided in two parts:
- Primary Combination of all (global or densification) solutions containing positions and velocities for all stations
- Other Densification solutions which will be added in a second step
Submitted TRF solutions
| Technique | AC | Data Span | Station | Constraints | Included 1 |
|---|---|---|---|---|---|
| Analysis Center(AC) | SSC | Number | |||
| VLBI | |||||
| Geodetic Institute of Bonn University | (GIUB) 00 R 01 | 84-99 | 51 | Loose | yes |
| Goddard Space Flight Center | (GSFC) 00 R 01 | 79-99 | 130 | Loose | yes |
| Shanghai Astronomical Observatory | (SHA) 00 R 01 | 79-99 | 127 | Loose | yes |
| LLR | |||||
| Forschungseinrichtung Satellitengeodaesie | (FSG) 00 M 01 | 77-00 | 3 | Loose | yes |
| Unversity of Texas, McDonald Observatory | (UTXMO)00 M 01 | 70-00 | 5 | Tight | |
| SLR | |||||
| Australian Surveying and Land Information Group | (AUS) 00 L 01 | 92-00 | 55 | Loose | yes |
| Centro Geodesia Spaziale, Matera | (CGS) 00 L 01 | 84-99 | 94 | Loose | yes |
| Central Laboratory for Geodesy, Sofia | (CLG) 00 L 01 | 84-00 | 68 | Tight | |
| Communications Research Laboratory | (CRL) 00 L 02 | 90-00 | 60 | Loose | yes |
| Center for Space Research | (CSR) 00 L 01 | 76-00 | 139 | Loose | |
| Center for Space Research | (CSR) 00 L 04 | 76-00 | 139 | Loose | yes |
| Delft Ins. Earth Oriented Space Research | (DEOS) 00 L 01 | 83-99 | 91 | Loose | yes |
| Deutsches GeodM-dtisches Forschungsinstitut | (DGFI) 00 L 01 | 90-00 | 43 | Removable | yes |
| Goddard Space Flight Center | (GSFC) 00 L 01 | 86-00 | 36 | Unclear | |
| Joint Center for Earth System Technology, GSFC | (JCET) 00 L 05 | 93-00 | 48 | Loose | yes |
| GPS | |||||
| Center for Orbit Determination in Europe | (CODE) 00 P 03 | 93-00 | 160 | Minimum | yes |
| GeoForschungsZentrum Potsdam | (GFZ) 00 P 01 | 93-00 | 98 | Minimum | yes |
| International GPS Service by Natural Resources Canada |
(IGS) 00 P 46 | 96-00 | 179 | Minimum | yes |
| Jet Propulsion Laboratory | (JPL) 00 P 01 | 91-99 | 112 | Minimum | yes |
| Univ of Newcastle upon Tyne | (NCL) 00 P 01 | 95-99 | 90 | Minimum | yes |
| NOAA, National Geodetic Survey | (NOAA) 00 P 01 | 94-00 | 165 | Removable | yes |
| DORIS | |||||
| Australian Surveying and Land Information Group | (AUS) 00 D 01 | 98-99 (231 D) | 55 | Loose | |
| Groupe de Recherche de Geodesie Spatiale | (GRGS) 00 D 01 | 93-00 | 66 | Loose | yes |
| Institut Géographique National | (IGN) 00 D 09 | 92-00 | 80 | Minimum | yes |
| Multi-technique (SLR + DORIS + PRARE) | |||||
| GRIM5 project (GRGS+GFZ) | (GRIM) 00 C 01 | 85-99 | 183 | Loose | yes |
| CSR: SLR + DORIS on TOPEX | (CSR) 00 C 01 | - | 147 | Loose | yes |
| GPS Densification | |||||
| South America Network by Deutsches GeodM-dtisches Forschungsinstitut |
(DGFI) 00 P 01 | 96-00 | 31 | Loose | yes |
| IAG Subcommission for Europe (EUREF) by Bundesamt fuer Kartographie und Geodaesie |
(EUR) 00 P 03 | 96-00 | 81 | Minimum | yes |
| European Vertical Reference Network by CODE |
(EUVN) 00 P 01 | (1 W in 97) | 217 | Removable | |
| Geophysical Institute, University of Alaska | (GIA) 00 P 01 | 96-99 | 20 | Minimum | |
| Institut Géographique National | (IGN) 00 P 01 | 98-00 | 28 | Minimum | yes |
| Jet Propulsion Laboratory | (JPL) 00 P 02 | 91-99 | 28 | Minimum | yes |
| Antartica network by Institut Géographique National |
(IGN) 00 P 02 | 95-00 | 17 | Minimum | yes |
| NIMA GPS Monitor Network | (NIMA) 00 P 01 | 95-99 | 11 | Unclear | |
| CORS Network by NOAA | (CORS) 00 P 01 | 94-99 | 80 | Removable | yes |
| REGAL Network, France | (REGAL) 00 P 03 | 96-00 | 29 | Minimum | yes |
| Antartica SCAR network by Institut fuer Planetare Geodaesie, TU Dresden |
(SCAR) 00 P 02 | 95-99 | 66 | Removable | yes |
| Turkey GPS Network | (TURK) 00 P 01 | (2 W in 97) | 10 | Removable |
-
Solution included in the analysis ↩
Frame Definition
Origin (translations and rates)
Weighted average of SLR solutions (CGS, CRL, CSR, DGFI, JCET).
Scale and rate
Weighted average of the following VLBI and SLR solutions:
- VLBI: GIUB, GSFC, SHA
- SLR: CGS, CRL, CSR, DGFI, JCET
Orientation
Insured upon a selection of ITRF sites with high geodetic quality.
- Rotations: ITRF97 at 1997.0 epoch
- Rotation rates: No Net Rotation w.r.t. NNR-NUVEL1A
The criteria retained for site selection are :
- Continuously observed during at least 3 years
- Located on rigid plates and far away from deforming zones
- Velocity formal error (as result of ITRF combination) better than 3 mm/y
- Velocity residuals less than 3 mm/y for at least 3 different solutions
Based on the ITRF2000 preliminary analysis, sites selection was performed using the above criteria yielding 54 SITES shown in the following figure (blue dots).
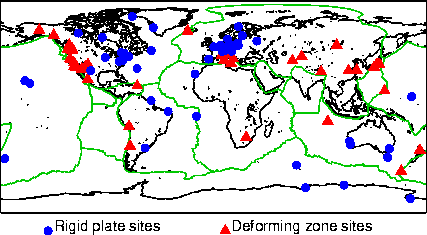
This Figure shows also 41 SITES (red dots) satisfying 1, 3, 4 criteria.
Moreover, Bahrein (Arabian plate) and Easter Island (Nazca plate) are found to have estimated ITRF2000 velocities which disagree with NNR-NUVEL-1A by about 6 and 10 mm/, respectively. In addition, Tromsoe (Eurasian plate) and Flin-Flon (North American plate) show, respectively, about 2 mm/y post fit residual after absolute rotation poles estimation. Consequently, excluding these four sites, only 50 sites located on rigid plates were used in the ITRF2000 orientation rate definition.
Following the ITRF2000 Workshop Recommendations, it was agreed to reject all outliers from the individual solutions. The list of all rejected stations from the individual solutions is given HERE.
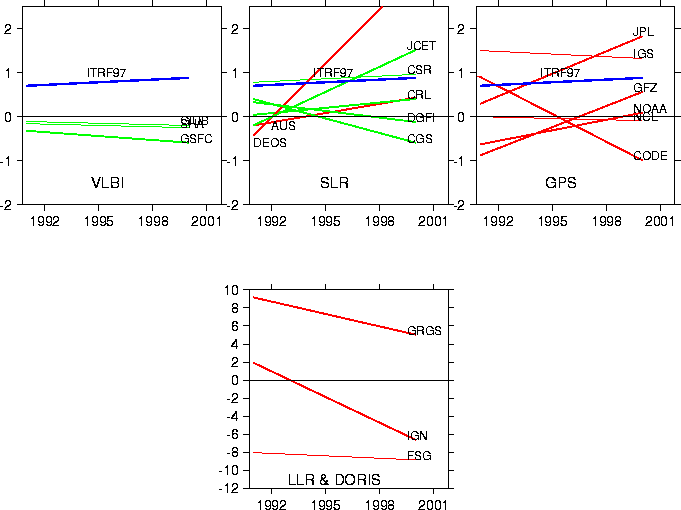
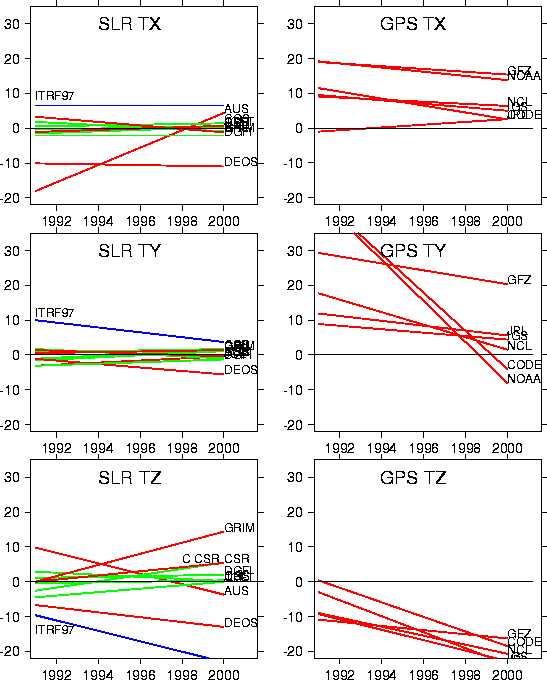
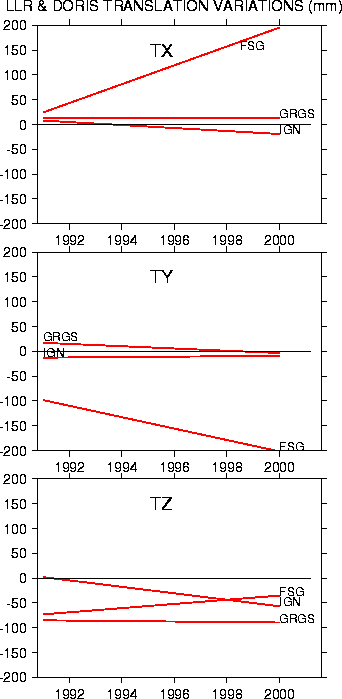
Primary Combination Results
- Transformation Parameters and Residuals
- Plot of Scale variations
- Plot of SLR & GPS Translation variations
- Plot of LLR & DORIS Translation variations
- Primary ITRF2000 Map
- Local Ties used in ITRF2000
- Local Tie problems in ITRF2000
Primary ITRF2000 Station Positions/Velocities
The ITRF2000 adjusted positions at epoch 1997.0 and velocities were split into several tables and SINEX files. The subsets are :
- VLBI technique
- SLR technique
- GPS technique
- DORIS technique
- EUREF GPS stations
- EUREF points (GPS and others in Europe)
- CORS Network
- ALASKA Network
- South America Network
- SCAR Network
- REGAL Network
- RGP Network
Moreover, compressed SINEX files for the following networks are also available via anonymous ftp:
- ITRF2000 VLBI
- ITRF2000 SLR
- ITRF2000 GPS
- ITRF2000 DORIS
- ITRF2000 EUREF Perm. GPS
- ITRF2000 EUROPE
- ITRF2000 CORS
- ITRF2000 ALASKA
- ITRF2000 SIRGAS
- ITRF2000 SCAR
- ITRF2000 REGAL
- ITRF2000 RGP
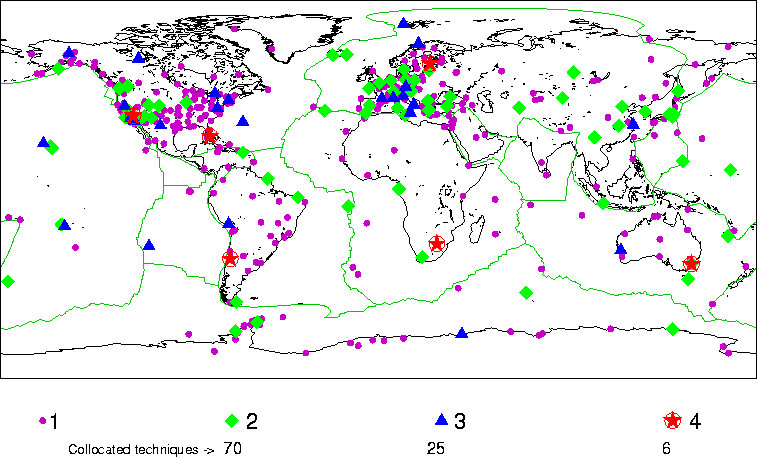
Post Fit ITRF2000 Residuals in Colocation sites
Histograms of post-fit residuals per technique
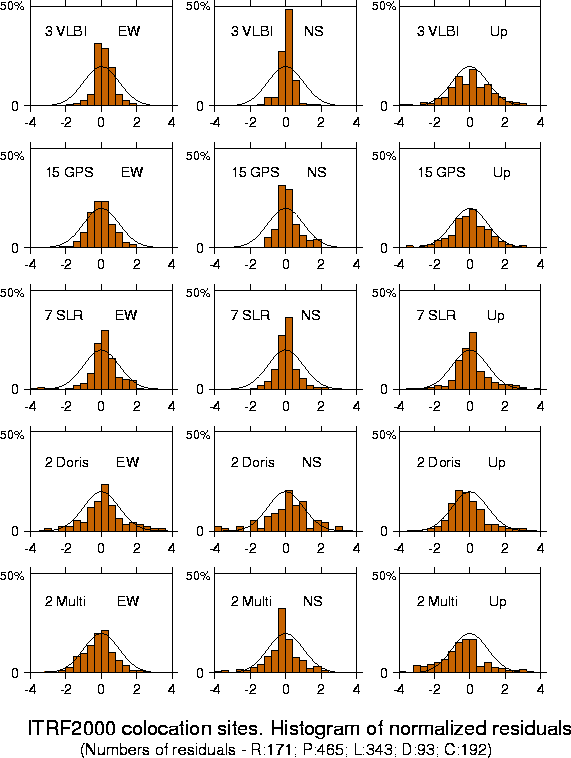
Global histograms of post-fit residuals

Colocation sites
     DOMES   Lon.  Lat.   Ties     Points/techn.       Post-fit residuals       Site name
     Number (deg) (deg)            R  M  P  L  D     Values        Plots

   1 13212     .4  50.9      1     0  0  2  1  0   Pos.  Vel.  /Centr  /Techn.  HERSTMONCEUX
   2 10003    1.5  43.6      3     1  0  1  0  2   Pos.  Vel.  /Centr  /Techn.  TOULOUSE
   3 13504    5.8  52.2      2     0  0  1  2  0   Pos.  Vel.  /Centr  /Techn.  KOOTWIJK
   4 10002    6.9  43.8      3     1  1  1  2  0   Pos.  Vel.  /Centr  /Techn.  GRASSE
   5 14001    7.5  46.9      2     0  0  2  2  0   Pos.  Vel.  /Centr  /Techn.  ZIMMERWALD
   6 12725    9.0  39.1      1     0  0  1  2  0   Pos.  Vel.  /Centr  /Techn.  CAGLIARI
   7 32809    9.7    .4      2     0  0  1  0  2   Pos.  Vel.  /Centr  /Techn.  LIBREVILLE
   8 12711   11.4  44.5      2     2  0  1  1  0   Pos.  Vel.  /Centr  /Techn.  MEDICINA
   9 10317   11.9  78.9      3     1  0  2  0  1   Pos.  Vel.  /Centr  /Techn.  NY-ALESUND
  10 10402   11.9  57.4      2     2  0  1  0  0   Pos.  Vel.  /Centr  /Techn.  ONSALA
  11 12706   12.6  35.5      1     0  0  1  1  0   Pos.  Vel.  /Centr  /Techn.  LAMPEDUSA
  12 12717   12.8  36.7      2     1  0  1  1  0   Pos.  Vel.  /Centr  /Techn.  NOTO
  13 14201   12.9  49.2      6     2  0  2  6  0   Pos.  Vel.  /Centr  /Techn.  WETTZELL
  14 14106   13.1  52.4      1     0  0  1  2  0   Pos.  Vel.  /Centr  /Techn.  POTSDAM
  15 11001   15.5  47.1      1     0  0  2  1  0   Pos.  Vel.  /Centr  /Techn.  GRAZ LUSTBUEHEL
  16 12734   16.6  40.7      4     1  0  1  3  0   Pos.  Vel.  /Centr  /Techn.  MATERA
  17 12205   17.1  52.3      1     0  0  1  1  0   Pos.  Vel.  /Centr  /Techn.  BOROWIEC
  18 10302   18.9  69.7      3     1  0  3  1  0   Pos.  Vel.  /Centr  /Techn.  TROMSO
  19 30314   20.8 -32.4      1     0  0  1  1  0   Pos.  Vel.  /Centr  /Techn.  SUTHERLAND
  20 11101   23.4  42.7      1     0  0  1  1  0   Pos.  Vel.  /Centr  /Techn.  SOFIA
  21 12602   23.9  38.1      1     0  0  0  2  1   Pos.  Vel.  /Centr  /Techn.  DIONYSOS
  22 10503   24.4  60.2      3     1  0  1  2  1   Pos.  Vel.  /Centr  /Techn.  METSAHOVI
  23 12302   24.1  57.0      2     0  0  1  3  0   Pos.  Vel.  /Centr  /Techn.  RIGA
  24 30302   27.7 -25.9      5     1  0  3  1  2   Pos.  Vel.  /Centr  /Techn.  HARTEBEESTHOEK
  25 20805   32.8  39.9      1     0  0  2  1  0   Pos.  Vel.  /Centr  /Techn.  ANKARA
  26 66006   39.6 -69.0      3     1  0  1  0  2   Pos.  Vel.  /Centr  /Techn.  SYOWA
  27 12334   66.9  39.1      2     0  0  1  0  2   Pos.  Vel.  /Centr  /Techn.  KITAB
  28 91201   70.2 -49.4      2     0  0  1  0  2   Pos.  Vel.  /Centr  /Techn.  KERGUELEN
  29 12349   92.8  56.0      1     0  0  1  0  1   Pos.  Vel.  /Centr  /Techn.  KRASNOYARSK
  30 23101  106.8  -6.5      1     0  0  1  0  1   Pos.  Vel.  /Centr  /Techn.  CIBINONG
  31 50107  115.4 -29.1      3     0  0  2  2  2   Pos.  Vel.  /Centr  /Techn.  YARRAGADEE
  32 21601  115.9  39.6      1     0  0  1  1  0   Pos.  Vel.  /Centr  /Techn.  BEIJING
  33 21605  121.4  31.0      1     2  0  1  1  0   Pos.  Vel.  /Centr  /Techn.  SHANGHAI
  34 21730  140.1  36.2      1     2  0  1  0  0   Pos.  Vel.  /Centr  /Techn.  TSUKUBA
  35 91501  140.0 -66.7      1     0  0  1  0  1   Pos.  Vel.  /Centr  /Techn.  ILE DES PETRELS
  36 21732  142.2  27.1      1     2  0  0  0  0   Pos.  Vel.  /Centr  /Techn.  CHICHIJIMA
  37 50501  144.7  13.3      1     0  0  1  0  1   Pos.  Vel.  /Centr  /Techn.  GUAM
  38 50116  147.5 -42.9      4     1  0  2  0  0   Pos.  Vel.  /Centr  /Techn.  HOBART
  39 50103  149.0 -35.6      5     2  0  2  2  2   Pos.  Vel.  /Centr  /Techn.  CANBERRA
  40 50119  149.0 -35.3      2     0  0  0  1  1   Pos.  Vel.  /Centr  /Techn.  MOUNT STROMLO
  41 92701  166.4 -22.3      1     0  0  1  0  1   Pos.  Vel.  /Centr  /Techn.  NOUMEA
  42 50505  167.5   9.4      1     1  0  0  1  0   Pos.  Vel.  /Centr  /Techn.  KWAJALEIN ATOLL
  43 50207  183.4 -44.0      1     0  0  1  0  1   Pos.  Vel.  /Centr  /Techn.  CHATHAM ISLAND
  44 40424  200.3  22.1      3     2  0  1  0  1   Pos.  Vel.  /Centr  /Techn.  KAUAI
  45 40445  203.7  20.7      2     1  1  0  2  0   Pos.  Vel.  /Centr  /Techn.  MAUI
  46 40477  204.6  19.8      1     1  0  1  0  0   Pos.  Vel.  /Centr  /Techn.  MAUNA KEA
  47 92202  209.0 -16.7      2     0  0  0  2  1   Pos.  Vel.  /Centr  /Techn.  HUAHINE ( MOTU H
  48 92201  211.6 -17.6      4     0  0  3  1  2   Pos.  Vel.  /Centr  /Techn.  PAPEETE (TAHITI)
  49 40408  212.5  65.0      3     1  0  1  0  1   Pos.  Vel.  /Centr  /Techn.  FAIRBANKS
  50 40129  236.5  48.4      1     1  0  1  0  0   Pos.  Vel.  /Centr  /Techn.  VICTORIA/SIDNEY
  51 40420  239.4  34.6      1     1  0  2  0  0   Pos.  Vel.  /Centr  /Techn.  VANDENBERG AFB
  52 40433  239.1  40.0      3     1  0  1  3  0   Pos.  Vel.  /Centr  /Techn.  QUINCY
  53 40105  240.4  49.3      1     1  0  1  0  0   Pos.  Vel.  /Centr  /Techn.  PENTICTON
  54 40439  241.4  37.2      2     3  0  0  3  0   Pos.  Vel.  /Centr  /Techn.  OWENS VALLEY
  55 40400  241.8  34.2      2     1  0  4  1  0   Pos.  Vel.  /Centr  /Techn.  PASADENA
  56 40405  243.1  35.3     10     6  0  2  4  3   Pos.  Vel.  /Centr  /Techn.  GOLDSTONE
  57 40436  243.2  32.6      1     0  0  0  2  0   Pos.  Vel.  /Centr  /Techn.  SAN DIEGO - OTAY
  58 40407  243.6  33.4      1     1  0  1  0  0   Pos.  Vel.  /Centr  /Techn.  PINYON FLATS
  59 40497  243.6  32.9      3     1  0  1  3  0   Pos.  Vel.  /Centr  /Techn.  MONUMENT PEAK
  60 40127  245.5  62.5      3     2  0  2  0  1   Pos.  Vel.  /Centr  /Techn.  YELLOWKNIFE
  61 40438  248.6  41.9      1     0  0  0  2  0   Pos.  Vel.  /Centr  /Techn.  BEAR LAKE
  62 41703  250.6 -27.2      2     0  0  1  1  1   Pos.  Vel.  /Centr  /Techn.  EASTER ISLAND
  63 40456  252.1  34.3      1     1  0  1  0  0   Pos.  Vel.  /Centr  /Techn.  PIETOWN
  64 40496  255.3  40.2      1     1  0  0  1  0   Pos.  Vel.  /Centr  /Techn.  PLATTEVILLE
  65 40442  256.0  30.7      9     4  1  1  4  0   Pos.  Vel.  /Centr  /Techn.  FORT DAVIS
  66 40491  258.4  35.2      1     1  0  0  1  0   Pos.  Vel.  /Centr  /Techn.  FLAGSTAFF
  67 40465  268.4  41.8      1     1  0  1  0  0   Pos.  Vel.  /Centr  /Techn.  NORTH LIBERTY
  68 40499  279.6  25.6      5     2  0  4  1  1   Pos.  Vel.  /Centr  /Techn.  RICHMOND
  69 40104  281.9  46.0      2     1  0  1  1  0   Pos.  Vel.  /Centr  /Techn.  ALGONQUIN
  70 40451  282.9  38.9     10     2  0  2 15  0   Pos.  Vel.  /Centr  /Techn.  WASHINGTON
  71 40440  288.5  42.6      3     2  0  2  1  0   Pos.  Vel.  /Centr  /Techn.  WESTFORD
  72 42202  288.5 -16.5      3     0  0  1  2  1   Pos.  Vel.  /Centr  /Techn.  AREQUIPA
  73 41705  289.3 -33.2      4     1  0  2  2  2   Pos.  Vel.  /Centr  /Techn.  SANTIAGO
  74 41507  292.3 -53.8      3     0  0  2  0  2   Pos.  Vel.  /Centr  /Techn.  RIO GRANDE
  75 66007  292.1 -67.6      1     0  0  1  0  1   Pos.  Vel.  /Centr  /Techn.  ROTHERA
  76 43201  296.6  17.8      1     1  0  1  0  0   Pos.  Vel.  /Centr  /Techn.  SAINTE CROIX
  77 66008  303.9 -63.3      1     1  0  2  0  0   Pos.  Vel.  /Centr  /Techn.  O'HIGGINS
  78 97301  307.4   5.1      2     0  0  1  0  1   Pos.  Vel.  /Centr  /Techn.  KOUROU
  79 41602  321.6  -3.9      1     1  0  1  0  0   Pos.  Vel.  /Centr  /Techn.  FORTALEZA
  80 10202  338.1  64.2      2     0  0  1  0  2   Pos.  Vel.  /Centr  /Techn.  REYKJAVIK
  81 30602  345.6  -7.9      1     0  0  1  0  1   Pos.  Vel.  /Centr  /Techn.  ASCENSION III
  82 13402  353.8  36.5      1     0  0  1  2  0   Pos.  Vel.  /Centr  /Techn.  SAN FERNANDO
  83 10004  355.5  48.4      1     1  0  2  0  0   Pos.  Vel.  /Centr  /Techn.  BREST
  84 13407  355.7  40.4      1     3  0  2  0  0   Pos.  Vel.  /Centr  /Techn.  MADRID-ROBLEDO
Acknowledgement
Altamimi, Z., P. Sillard, and C. Boucher (2002), ITRF2000: A new release of the International Terrestrial Reference Frame for earth science applications, J. Geophys. Res., 107(B10), 2214.